Analytics: New pipeline reports


Suzan Dil
Our latest additions in Analytics makes it possible for you to see your candidates' journeys through your processes, and improve your conversion funnel. Two reports have been updated with new data, and the new Pipeline conversion report gives you deeper insight into your recruitment process.
To get detailed information in the pipeline reports, make sure to use stage types. This brings your recruitment processes together even if the funnel is different for each job, and helps you get a better overview of your recruitment 🎉
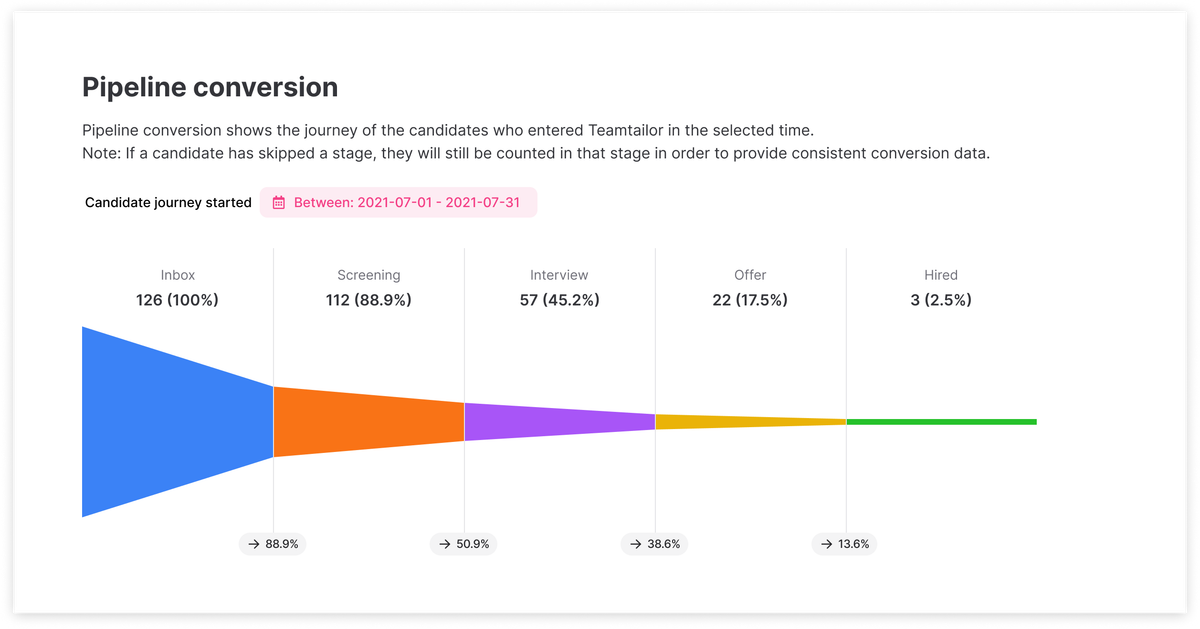
Pipeline conversion
A funnel view that shows how candidates progress through stages
This brand new report shows you the journey of the candidates through your processes. Filter on different times to see the conversion depending on when the candidates entered the process.

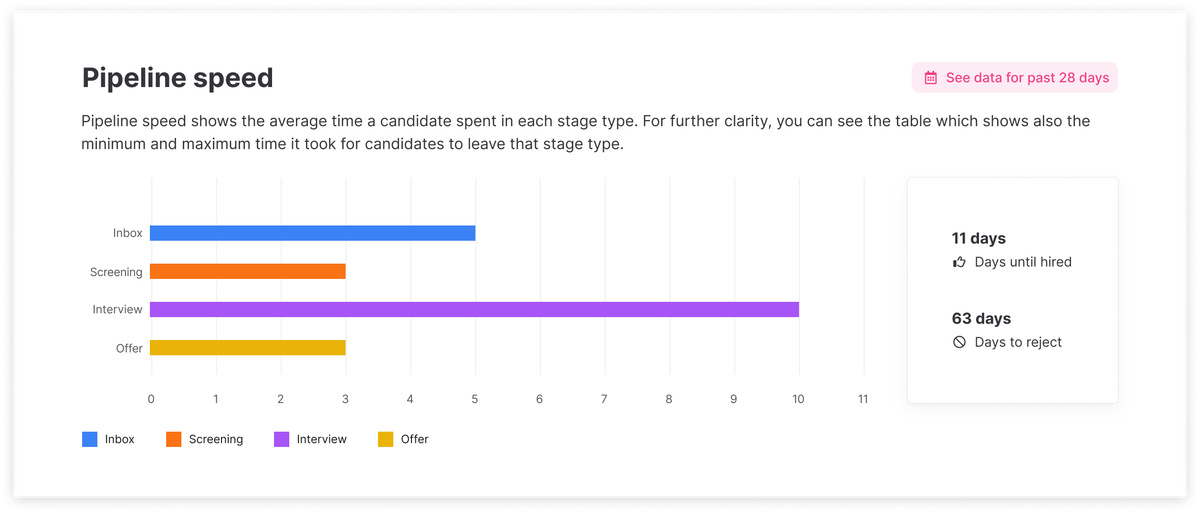
Pipeline speed
Average time candidates spend in each stage
Dig into the information about the average time a candidate spent in each stage type with this report. You can also see the average amount of days it took to hire or reject a candidate.

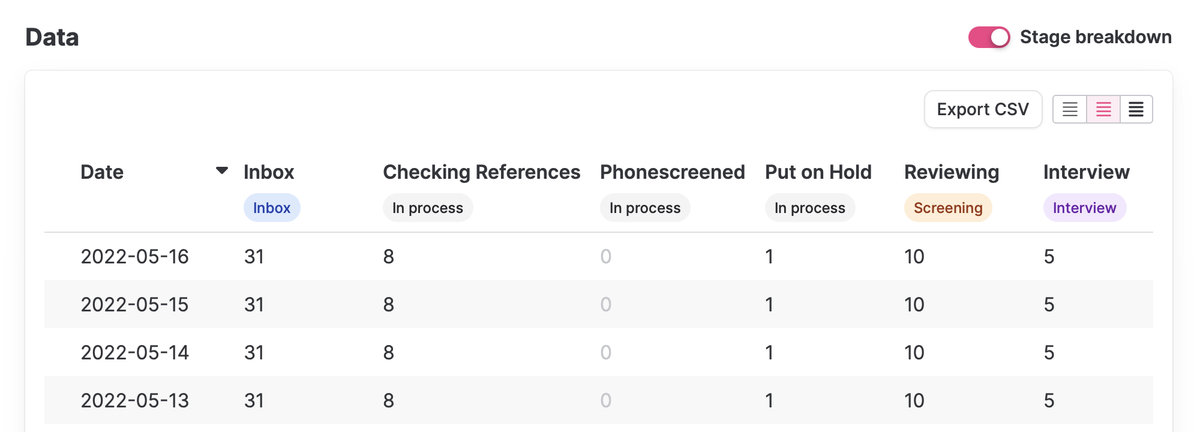
You can see the minimum and maximum time it took for candidates to leave a stage type, and break it down by stages.

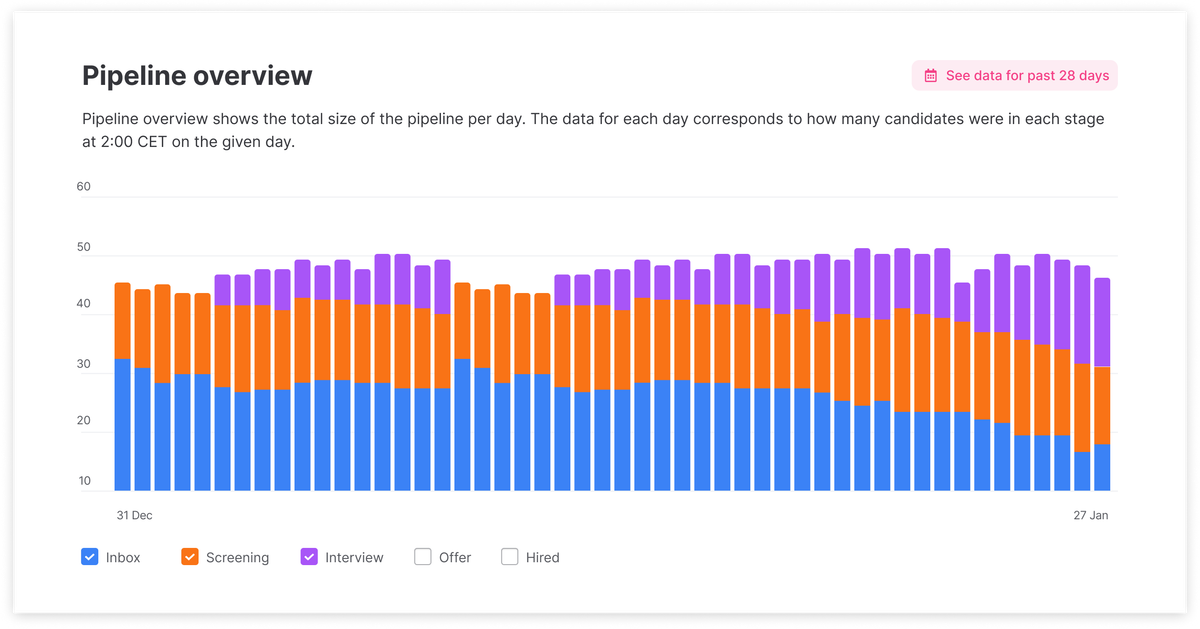
Pipeline overview
Daily snapshots of where your candidates are in the hiring process
Keep track of how your candidates are progressing in the pipeline overview report. Select which stages you want to see in the bottom.


We hope you and your team get a lot valuable information out of these new reports. Check out your own pipeline reports in Analytics right now, or read more about these new reports in our helpcenter.
❤️ /The Teamtailor Product Team
Recommended topics
![]()
Highlights from our latest releases ✨✨
We've collected the highlights from our latest releases. Co-pilot, historic reports and more.
![]()
Set a Job Name that's only shown internally
Make collaboration easier by naming your job what it's called internally, and use a different job ad title for the candidates to see.
![]()
Automatically add to-dos for new users 🥳
Add custom to-do templates so that each new user knows exactly what to do as they first log in, depending on their access level.


